When you invest in UX/UI optimization, you expect tangible returns—stronger customer loyalty, higher sales, and better engagement. The impact of UX/UI goes beyond aesthetics; it directly affects business performance and user behavior. This guide covers the most important metrics to track and how to use them to justify your investment.
Why ROI Measurement Is Critical
Many businesses see UX/UI work as a design expense rather than a revenue driver. Without clear metrics, its value can be underestimated. In reality, every usability improvement reduces friction, leading to measurable results like:
- Higher conversion rates
- Lower customer acquisition costs
- Increased average order value
Measuring ROI helps you:
- Identify which improvements deliver the highest value
- Focus resources on changes that drive results
- Build a strong business case for future UX/UI investments
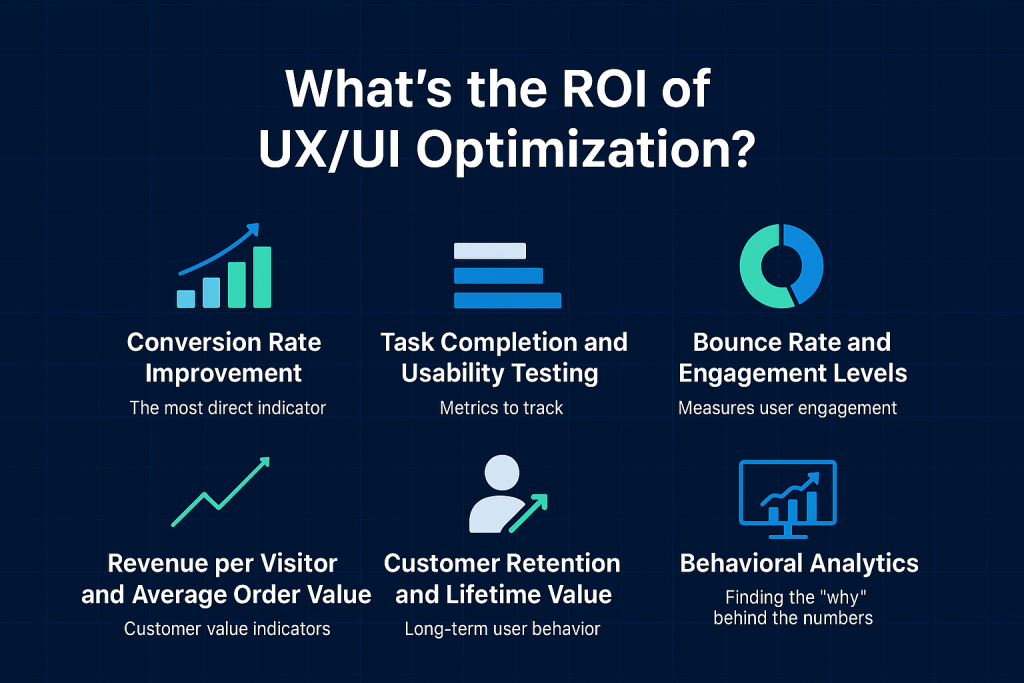
1. Conversion Rate Improvement — The Most Direct Indicator
Conversion rate is the clearest way to measure UX/UI effectiveness. When a site becomes easier to use, more visitors complete desired actions, such as purchases or sign-ups.
Why it matters:
- A 1% increase in conversion rate for ecommerce can translate into thousands in extra revenue
- Shows how well design aligns with user intent and removes obstacles
How to measure:
Track conversion rates before and after specific UX/UI changes—such as optimizing product page layouts or simplifying checkout.
2. Task Completion and Usability Testing Outcomes
Usability testing provides direct insight into how real users interact with your site, revealing where they struggle and how changes improve their experience.
Key metrics:
- Task success rate: Percentage of users completing an intended action
- Time on task: Time taken to complete an action (shorter is usually better)
- Error rate: Frequency of mistakes caused by unclear design
These metrics link usability improvements directly to business outcomes.
3. Bounce Rate and Engagement Levels
A high bounce rate suggests users leave after one page, often because the design fails to meet expectations.
Engagement metrics to track:
- Pages per session
- Average session duration
- Scroll depth
When combined with behavioral data, these metrics show how design changes affect retention and exploration.
4. Revenue per Visitor (RPV) and Average Order Value (AOV)
Optimized UX/UI not only converts more users but also encourages higher spending.
AOV increases when:
- Product recommendations are relevant and easy to find
- Checkout flow supports upselling and cross-selling without disrupting the process
- The site builds trust through security and clarity
RPV combines AOV and conversion rate to show the revenue contribution per visitor.
5. Customer Retention and Lifetime Value (CLV)
Good UX/UI builds loyalty, encouraging repeat purchases and increasing CLV.
Why it matters:
- Returning customers are less expensive to retain than acquiring new ones
- Higher CLV reflects long-term business stability
Track repeat purchase frequency and retention rates to measure lasting impact.
6. Behavioral Analytics — The “Why” Behind the Numbers
Analytics tools reveal not just what’s happening, but why.
Key tools include:
- AI heatmaps for visual attention patterns
- Session recordings for watching user interactions
- Funnel analysis to pinpoint conversion drop-off points
These insights connect numbers to design elements, guiding targeted improvements.
7. Journey Mapping for Complete Flow Analysis
Journey mapping goes beyond single-page interactions, showing the full user path.
Why it’s useful:
- Highlights how users navigate from entry to checkout
- Identifies friction points across the journey
- Prioritizes redesign efforts where impact is highest
Connecting Metrics to ROI
ROI formula: ROI=Revenue Increase from UX/UI Changes−Cost of OptimizationCost of Optimization×100ROI = \frac{\text{Revenue Increase from UX/UI Changes} – \text{Cost of Optimization}}{\text{Cost of Optimization}} \times 100ROI=Cost of OptimizationRevenue Increase from UX/UI Changes−Cost of Optimization×100
Example:
If a redesign costs $20,000 but generates $100,000 in additional revenue in six months, the ROI is 400%.
By linking metrics like conversion rate, AOV, and retention to revenue growth, UX/UI becomes a measurable growth investment—not just a design expense.
Conclusion: Measure What Moves the Needle
The ROI of UX/UI optimization is reflected in metrics that directly impact revenue. Conversion rates, usability testing results, engagement levels, AOV, retention, and behavioral analytics all provide evidence of success. When combined with journey mapping and ongoing testing, these insights ensure your UX/UI investment drives measurable business growth.
Frequently Asked Questions (FAQ)
1. How long does it take to see ROI from UX/UI changes?
Most businesses begin seeing measurable results within 1–3 months, especially if the changes address key friction points in the user journey.
2. What’s the most important metric for UX/UI ROI?
Conversion rate improvement is often the most direct indicator, but combining it with metrics like Average Order Value and Customer Lifetime Value gives a more complete picture.
3. Do small UX changes make a measurable difference?
Yes. Even small improvements—such as clearer CTAs or faster load times—can significantly boost conversions and engagement.
4. Why track behavioral analytics alongside performance metrics?
Behavioral analytics explains why users act the way they do, helping you connect metrics to real design issues and make data-backed improvements.
5. Can UX/UI optimization also reduce marketing costs?
Yes. A smoother, more effective site improves conversion rates, which can lower Customer Acquisition Costs (CAC) by making your marketing more efficient.
6. Is UX/UI optimization a one-time investment?
No. User behavior and market trends change over time, so continuous testing and optimization are essential for maintaining strong ROI.

